
Telematics Overload: When More Alerts Mean Less Action
A modern fleet throws off more telematics data than any operations team can consume. Machines, sensors, and controllers stream fault codes, utilization and idle figures, fuel burn, and threshold warnings around the clock. Telematics overload is the point at which alerts outnumber the people who could act on them, and real failure signals get buried under hundreds of notifications that carry no operational consequence.
The question worth asking is narrower: which alerts actually predict downtime? A warning light is not a breakdown. Telling the alerts that precede a machine stoppage from the ones that never will is what separates a working maintenance program from a queue nobody reads.
A Scaling Problem, Not a Hardware Problem
The sensing is not the hard part. Equipment makers have spent decades putting telematics into construction and agricultural machinery. Zoomlion, for one, ships telematics across its global equipment lines, and the instrumentation now arrives as standard equipment rather than a differentiator. The hardware reports reliably; interpretation is what strains.
The strain grows with the fleet. Doubling the number of connected machines does more than double alert volume. It multiplies the relationships between components, operating conditions, and threshold logic, so false positives scale faster than headcount.
The rest of this guide covers how alert libraries are structured, which signal types correlate with downtime, and how to build triage rules that keep attention on the warnings that matter.
What Alert Fatigue Is and Why It Derails Maintenance Planning
Alert fatigue is what happens when people get more notifications than they can process. In a fleet running fleet telematics, it sets in when the platform keeps producing warnings that are low-specificity, duplicated, or unrelated to actual failure risk.
How High-Volume Signals Desensitize Teams
When every minor threshold breach fires a push notification, an email, and a dashboard flag, attention runs out fast.
- Operators tune out – repeated alerts with nothing to act on teach staff to dismiss messages unread.
- Managers batch-delete – inboxes fill with thousands of events, so review turns into bulk clearing.
- Real thresholds lose authority – when everything is urgent, nothing is.
Why Important Fault Signals Get Buried
The core problem is signal-to-noise ratio. A hydraulic overheat or transmission fault can land between dozens of routine geofence exits and idling notices.
- Noise crowds the queue – high-volume, low-specificity alerts push severe events off the top of the list.
- Context disappears – an isolated warning, with no trend behind it, rarely shows whether a component is genuinely degrading.
- Response slips – by the time someone notices the real fault, the repair window has often closed.
The Shift from Proactive to Reactive Maintenance
Alert fatigue erodes predictive maintenance. Once teams stop trusting the data, they drop condition-based scheduling and run equipment until it breaks. That posture drives emergency repairs, unplanned downtime, and inflated parts bills.
Equipment uptime suffers first: machines sit idle waiting for urgent service instead of being serviced on a planned schedule. The fleet loses the foresight telematics was supposed to provide. Getting it back starts with fewer, sharper, better-scoped alerts.
The Most Common Telematics Alert Categories
Fleet managers facing a full alert queue end up guessing which buzz deserves action. The categories below account for most notifications on modern equipment fleets, and each note says whether it usually points to real downtime risk.
- Engine fault codes (DTCs) – These range from sensor glitches to critical mechanical failures; high-severity codes almost always mean genuine downtime risk.
- Fluid and pressure thresholds – Low oil, coolant, or hydraulic pressure usually means a leak or a failing part, so the downtime risk is often real.
- Battery and voltage warnings – A voltage drop can strand equipment and prevent starting, which makes it a moderate-to-high risk.
- Idle and utilization flags – These highlight excessive idling or underused assets, an efficiency and cost concern rather than a near-term failure.
- Geofence and GPS events – Boundary breaches and location pings track movement and security but rarely predict mechanical failure.
- Maintenance-due reminders – Scheduled service prompts prevent future breakdowns; on their own the immediate risk is low, though ignoring them raises it.
- Temperature and overheating alerts – Climbing engine or hydraulic temperatures can cascade into severe damage.
- Fuel level anomalies – Sudden drops may indicate theft or a leak and can force unplanned refueling stops, a moderate risk to uptime.
- Harsh driving and impact events – Hard braking, cornering, and collision detection flag operator behavior and possible damage, with an indirect effect on downtime.
- After-treatment and emissions faults (DEF/DPF) – These can trigger engine derates that take a machine out of service.
Alert Types vs. Downtime Prediction Value
Not every buzz from your telematics platform deserves a midnight phone call. The table below ranks six common alert families by how much they actually tell you about an imminent breakdown. Use the Downtime Predictive Strength column as your triage guide: anything rated High or Very High earns a place on the escalation list, while Low alerts belong in a weekly digest.
| Alert Category | Typical Trigger | False-Positive Frequency | Downtime Predictive Strength | Recommended Action |
|---|---|---|---|---|
| Engine Faults (DTCs) | Stored diagnostic trouble code on the CAN bus, e.g. misfire or aftertreatment sensor out of range | Medium to High (single codes often clear themselves) | High (clusters of recurring codes precede failure) | Escalate recurring or multi-code patterns; log one-off codes for trend review |
| Hydraulic Pressure | Pressure drops below or spikes above the envelope during operation | Low to Medium (sensor drift causes noise) | Very High (loss of pressure stops the machine fast) | Escalate immediately; dispatch service before the next shift |
| Temperature Thresholds | Coolant, oil, transmission, or hydraulic fluid exceeds a set point | Medium (ambient heat and heavy load skew readings) | High when sustained, Low when momentary | Escalate sustained over-temp; downgrade brief spikes to trend monitoring |
| Battery / Voltage | Voltage sag, low cranking voltage, or charging-system warning | Medium (cold starts trigger false low-voltage flags) | Medium to High (points to no-start and electrical gremlins) | Escalate repeating low-voltage events; schedule battery and alternator checks |
| Idle / Utilization | Idle time, engine hours, or utilization drifting outside expected bands | High (short pauses and traffic generate noise) | Low (weak direct link to hard failure) | Do not escalate as a fault; review in monthly utilization reporting |
| Geofence Events | Asset crosses a boundary or enters an unauthorized zone | High (GPS jitter and site mapping errors) | Low for mechanical downtime, High for security/theft response | Do not treat as a maintenance alert; route to security or dispatch workflows |
How to Read This Table
- Escalate engine-fault clusters, hydraulic-pressure loss, and sustained temperature alerts. These three carry the strongest true-positive signal for unplanned downtime.
- Watch and batch battery/voltage and idle/utilization alerts. They are useful context but rarely worth an interrupt.
- Redirect geofence events to security and dispatch rather than maintenance queues; they describe location, not mechanical health.
A smaller, sharper escalation list beats a flooded inbox. Rank every alert family by predictive strength before you route it, and your crew will trust the ones that matter.
Separating Signal from Noise
A fleet telematics platform produces far more alerts than any team can investigate. The job is not to read every one; it is to find the ones that actually predict downtime, and that depends on the data behind each notification.
Fault Code Severity Is the First Filter
Codes tied to emissions or intermittent electrical glitches rarely precede a breakdown, while codes for low oil pressure, overheating, or transmission faults correlate strongly with imminent failures. Classifying alerts by severity, instead of treating every code alike, removes a large share of low-value noise.
Sensor Trends Matter More Than Single Readings
A single out-of-range reading is often a sensor artifact. A gradual trend, such as rising coolant temperature or slowly declining battery voltage, tells you far more. This is where predictive analytics earns its value: instead of reacting to a spike, the system models direction and rate of change to estimate when a component will cross its failure threshold.
Duration and Repetition Signal Persistence
How long an abnormal reading lasts, and how often it recurs, separates transient events from genuine problems. A code that clears in seconds may be a momentary voltage dip. The same code recurring across several duty cycles is evidence of a developing fault.
Correlation Beats Isolation
One signal is ambiguous; combinations are not. Pairing a rising temperature trend with more frequent DPF regeneration, or linking low voltage with repeated cranking failures, produces stronger evidence than any single alert. Correlating multiple signals raises confidence and cuts false positives.
Threshold Alerts vs. Trend-Based Alerts
Threshold alerts fire when a value crosses a fixed limit. They are simple and reliable but inherently late, since the fault is already present. Trend-based alerts fire on the rate of change, giving maintenance teams lead time to schedule repairs before failure. Fixed limits handle the obvious cases; trends handle the ones that would otherwise surprise you.
The measure that matters is not how many alerts fired but which ones predicted downtime. Teams that weight severity, trend, duration, and correlation can cut alert volume while keeping the alerts worth acting on.
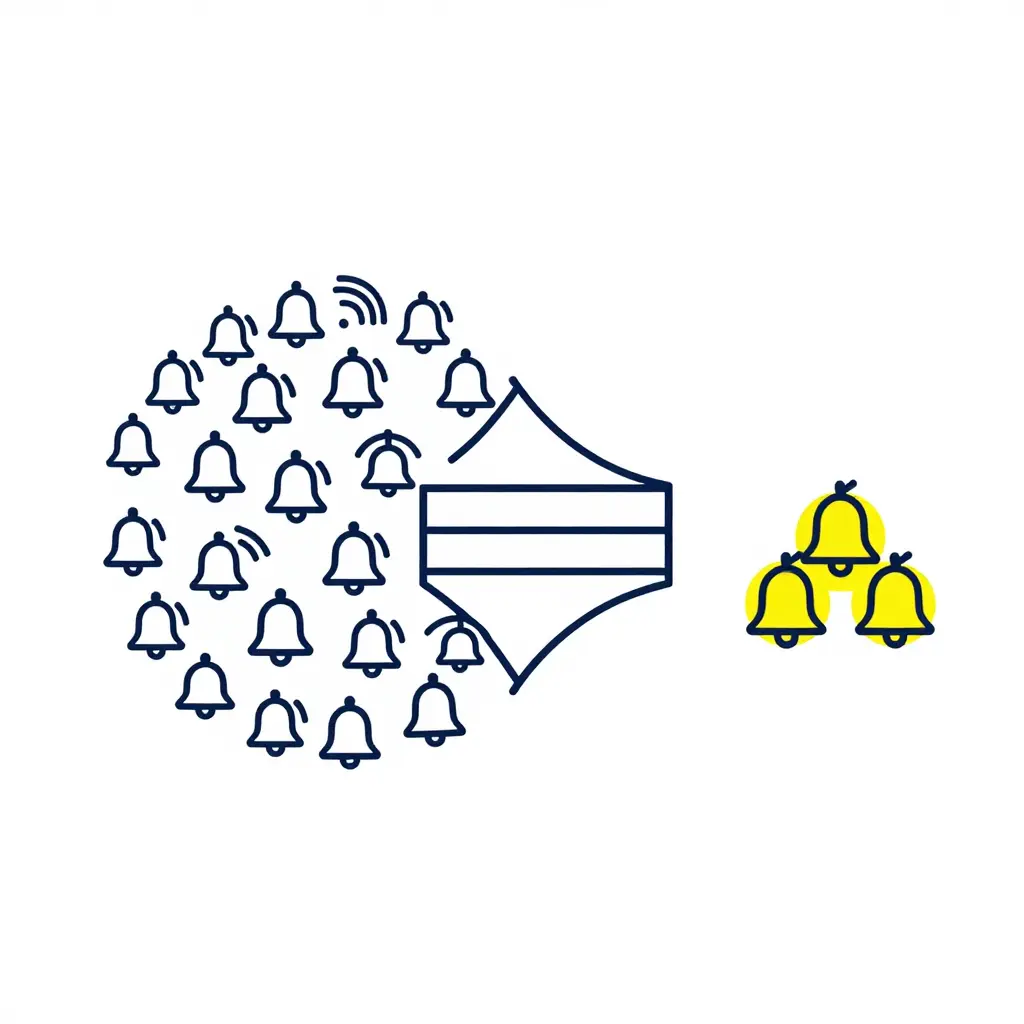
Conceptual diagram: a flood of raw telematics alerts (left) passes through a filtering gate (center) to yield a small set of high-value downtime signals (right).
Ranking Alerts by Predictive Power
A fleet dashboard can push hundreds of alerts a month, and only a handful reliably point to a machine that is about to break. Ranking alert categories by how tightly they correlate with real, unplanned downtime is the fastest way to act only when it matters.
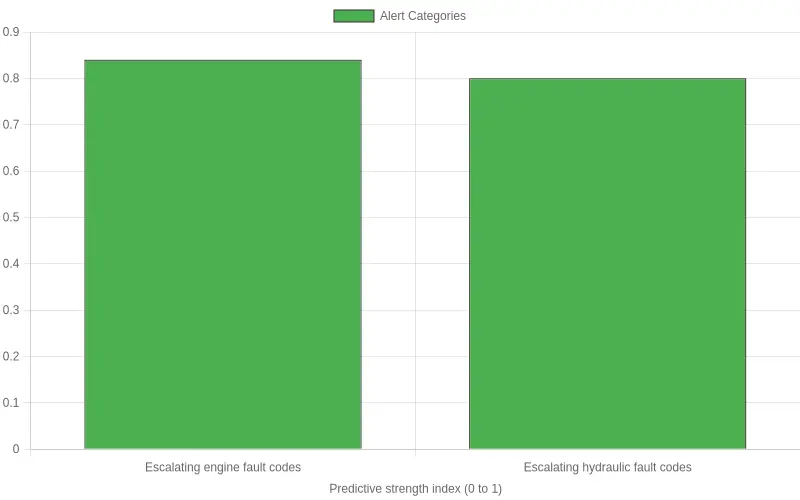
Tier 1: Strong downtime prediction signals
Escalating engine fault codes. A single fault code is often a sensor glitch. A sequence that climbs in severity over several days is different: it tracks worn injectors, a failing turbo, or a degrading fuel-delivery system, and those progressive patterns follow the wear cycles that dominate diesel failures.
Escalating hydraulic fault codes. On excavators, wheel loaders, and tractors, rising hydraulic pressure faults follow seal degradation, pump wear, and fluid contamination. Hydraulics drive nearly every work function, so this category turns into hard downtime faster than almost any other.
Sustained overheating trends. A brief temperature spike on a hot afternoon is normal. A slow upward drift in coolant or oil temperature across weeks signals clogged coolers, low coolant, or a failing water pump, all classic precursors to catastrophic engine damage. Trended overheating is one of the strongest inputs into downtime prediction.
Tier 2: Moderate signals
Repeated aftertreatment (DPF/DEF) faults and slow battery-voltage decay sit in the middle. They seldom stop a machine today, but they shorten component life and frequently surface in the weeks before a repair.
Tier 3: Low-value noise
Single geofence exits and brief idle flags almost never precede failure. They describe operator behavior, not machine condition. A loader leaving a site boundary, or idling for ten minutes while a bucket is swapped, is a coaching or scheduling matter, not a maintenance trigger.
| Tier | Alert category | Typical failure link |
|---|---|---|
| High | Escalating engine fault codes | Injector, turbo, fuel system |
| High | Escalating hydraulic fault codes | Seal, pump, contamination |
| High | Sustained overheating trends | Cooling system, water pump |
| Medium | Repeated DPF/DEF faults | Aftertreatment clogging |
| Medium | Battery voltage decay | Starting and electrical failure |
| Low | Single geofence exit | None (behavioral) |
| Low | Brief idle flag | None (behavioral) |
How machine health data changes the game
Global equipment makers now structure service around machine health data rather than raw alert counts. Zoomlion, for instance, feeds telematics and fault-code history into its maintenance planning so technicians are dispatched on trends, not single triggers. That shift is what turns a cluttered alert stream into genuine downtime prediction, and the same logic works for any fleet, large or small: weight the alerts that lead the failure curve, and quiet the ones that merely describe the workday.
Chase escalating fault codes and overheating trends. Let geofence pings and idle flags inform operations, not your maintenance calendar.
Which Alerts Actually Predict Downtime?
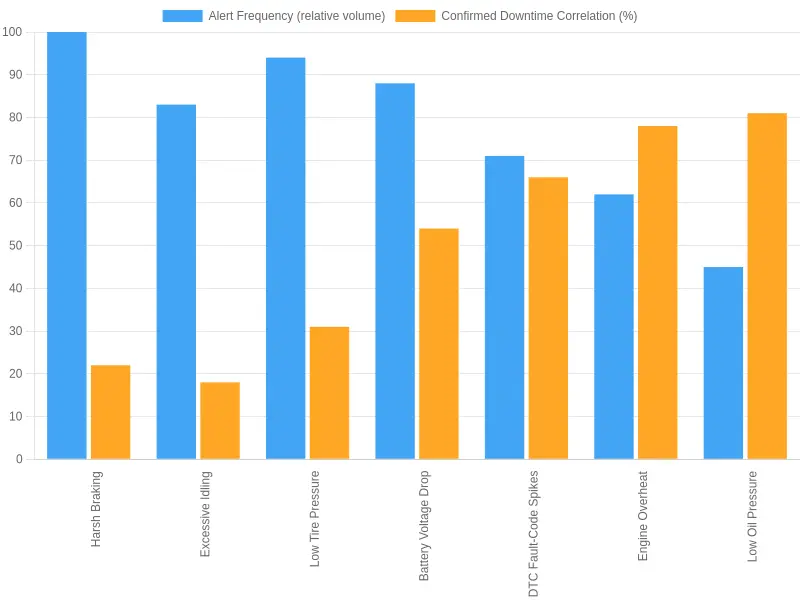
The chart above plots two bars for each of seven telematics alert categories: the blue bar shows alert frequency (how noisy the signal is), while the orange bar shows the confirmed downtime correlation (how often that alert actually preceded a real breakdown). The widening gap between the two bars shows which alerts actually predict downtime, and which are just adding clutter to your inbox.
| Alert Category | Alert Frequency (relative) | Confirmed Downtime Correlation | Verdict |
|---|---|---|---|
| Harsh Braking | 100 | 22% | Noisy |
| Excessive Idling | 83 | 18% | Noisy |
| Low Tire Pressure | 94 | 31% | Mostly noisy |
| Battery Voltage Drop | 88 | 54% | Mixed |
| DTC Fault-Code Spikes | 71 | 66% | Predictive |
| Engine Overheat | 62 | 78% | Predictive |
| Low Oil Pressure | 45 | 81% | Highly predictive |
What the pattern tells you: the loudest alerts are rarely the smartest. Harsh braking and excessive idling dominate your notification feed yet correlate with genuine downtime only about one time in five, because they describe driving behavior, not mechanical failure. Low oil pressure, by contrast, fires the fewest alerts of any category but precedes real downtime 81% of the time. Signal-to-noise, not raw volume, is the number that matters.
Reducing False Positives and Prioritizing Alerts
Telematics overload rarely comes from having too many sensors. It comes from too many alerts that say the same thing with the same level of urgency. When a low-fuel ping, a coolant drift, and a brake-pressure drop all land in one inbox, operators stop reading. The goal is not fewer signals but fewer worthless ones.
Route by severity, not by sensor
Sort every rule into a tier based on the consequence of ignoring it, then send each tier to its own channel and owner.
| Tier | Example condition | Routing channel | Target response |
|---|---|---|---|
| Critical | Oil pressure loss, engine overspeed | SMS and phone to on-call technician | 15 minutes |
| High | Coolant temperature trend, low DEF | Push notification to shift lead | Same shift |
| Medium | Battery voltage sag, tire pressure drift | Daily digest email | 24-48 hours |
| Low | Idle ratio, route deviation | Weekly report only | Review cycle |
Tune thresholds to the asset and the duty cycle
One global threshold guarantees false positives. A generator running at constant load and a loader cycling every ninety seconds have almost nothing in common. Baseline each asset class, adjust for season and site conditions, and re-tune after major repairs or component swaps.
Suppress duplicates and group incidents
Deduplicate on asset ID plus fault code plus a rolling time window. A sensor that trips four times in ten minutes is one incident, not four messages. Cooldowns, debounce timers, and parent-child grouping are standard features on most platforms, and are usually switched off by default.
Write escalation rules before you need them
Decide who owns an unacknowledged alert after fifteen minutes, after four hours, and overnight. Unassigned alerts are the fastest route back to noise, so name a backup owner for every tier.
Practical recommendations
- Audit every rule quarterly and delete the ones nobody has actioned.
- Track alert-to-work-order conversion and retire rules that fall below roughly ten percent.
- Keep one dashboard for trend-only signals that never page anyone.
- Document escalation paths inside your fleet maintenance workflow so technicians know the expected response.
- Review alert volume per operator per shift; a sudden spike usually means a sensor fault, not a fleet-wide failure.
When thresholds, routing, and escalation are aligned, the alerts that remain tend to be the ones that genuinely precede downtime. That is the point at which a telematics program stops being background noise and starts shaping decisions.
Frequently Asked Questions About Telematics Overload
What exactly is telematics overload?
Telematics overload happens when a fleet’s monitoring platform produces more alerts, notifications, and data streams than a manager can review or act on. The dashboard turns noisy instead of clear, and critical signals blur into routine ones. The result is alert fatigue, slower response times, and maintenance decisions made on gut feeling rather than insight.
Which alerts most reliably predict downtime?
The signals that best forecast downtime are usually tied to progressive mechanical stress: rising engine coolant temperature, oil pressure drops, transmission fault codes, and brake wear trends. They build over hours or days, which leaves time to schedule a repair before a vehicle fails on the road. Favor trend-based indicators over one-off threshold trips, and compare them against your own repair history to see which ones hold up.
How many alerts should a fleet monitor?
There is no magic number, but most well-managed fleets keep roughly 5 to 10 high-value alerts per vehicle class. That range covers the failure modes that genuinely threaten uptime without drowning operators in noise. A simple test: if your team cannot act on every alert within a single shift, you probably have too many.
Does cutting alert volume risk missing real failures?
Reducing volume is not about silencing warnings; it is about removing duplicates, stale thresholds, and low-impact notifications. When you focus on signals that map to actual breakdowns, you often miss fewer failures, because attention goes to what matters. Test candidate alerts against your own downtime records before trusting them.
How should we start prioritizing alerts?
Start by pulling 6 to 12 months of repair and downtime records and matching them against your alert logs. Rank each alert by how often it genuinely preceded a failure, then tier them into critical, watch, and informational groups. Retire or mute anything that never correlated with downtime, and review the list quarterly as your fleet and routes change.
What is the biggest mistake managers make with telematics?
Treating every factory-default alert as equally urgent. That flattens your priority list and trains staff to ignore notifications altogether. Curating a short, evidence-based alert set is what turns a firehose of data into a practical maintenance tool.
Turning Alert Overload into Focused Downtime Prediction
Moving from a flood of telematics notifications to calm, confident maintenance planning comes down to one hard-won truth: only a small subset of alerts carries genuine predictive value. The rest is noise, and noise is expensive. It pulls attention away from the signals that matter and trains teams to ignore the dashboard.
Practical next steps
- Audit your alert library. Pull 90 days of history and rank every alert by how often it preceded a real failure versus how often it fired with no consequence.
- Set severity tiers. Reserve urgent channels for the handful of signals tied to imminent breakdowns, and route everything else to a daily digest.
- Tune thresholds to your fleet. Generic defaults rarely fit your duty cycles, so recalibrate fault codes, temperature, and fluid-pressure limits against your own baselines.
- Close the loop with operators. Their field context turns a raw alert into a verified condition worth acting on.
- Review monthly. Predictive value drifts with seasons, routes, and machine age, so treat the shortlist as a living document.
Looking ahead
Teams that know which alerts actually predict downtime stop reacting to every ping and start scheduling repairs before failures strike. The payoff is measurable: fewer unplanned stoppages, longer asset life, and maintenance crews focused where it counts.
The fleets that thrive next year will not be the ones with the most data, but the ones that know which signals to trust.